The Energy Journal is the premier publication of the International Association for Energy Economics. Explore the latest research and insights in energy economics by visiting our journal. IAEE members have unlimited access and special savings to the Energy Journal. View current and past articles, full back issues of the Journal, free of charge. Submission fees are waived for IAEE members who submit articles for publication in the Energy Journal.
About the Energy Journal
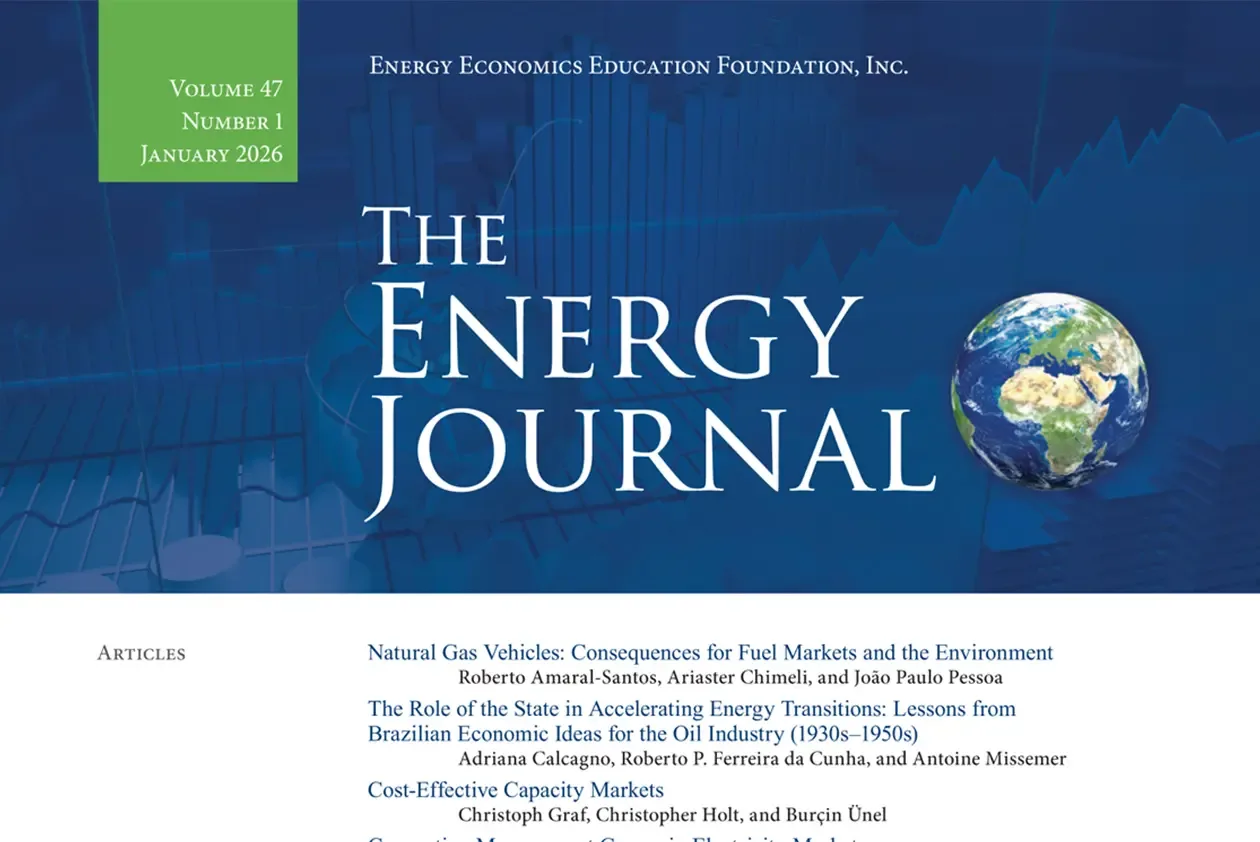
The Energy Journal is the flagship journal of the IAEE, and is widely recognized as one of the most selective, best regarded journals in the field. It was founded in 1980 to promote the advancement and dissemination of new knowledge concerning the economics of energy. Articles published in The Energy Journal provide rigorous and innovative analyses of interest to academics, energy industry professionals, civil servants and regulators, or the financial community.
Editor-in-chief: Pedro Linares
Impact Factor (2 year): 2.8
Impact Factor (5 year): 2.7
Meet the Editor-in-Chief
Pedro Linares
Professor of Industrial Engineering at the ICAI School of Engineering. Researcher at the Institute for Technology Research (IIT), Affiliate Researcher at the MIT CEEPR and the U. Cambridge EPRG, and Senior Fellow at Esade EcPol. Currently I serve as Director of the International Doctoral School of Comillas Pontifical University, and as Editor-in-Chief of The Energy Journal. I mostly devote my research to studying the relationship between energy, economics, and the environment, and specifically sustainable energy policy, energy efficiency, and energy models. I have published on most of these issues in the usual journals relevant to the field. I have also been a consultant for several private and public firms and institutions in Spain, Europe, and Latin America.

Aim & Scope
At The Energy Journal we strive to publish a blend of theoretical, empirical and policy related papers in energy economics. Interdisciplinarity is welcome, but only as long as the central focus is the economics of energy. The following papers are generally not acceptable:
- on energy issues in which no economic implications are analysed;
- on environmental topics in which no energy issues are explicitly dealt with;
- on economic issues where energy plays just a minor part.
We publish
- Research Articles that deal with theoretical or applied problems of continuing interest in energy economics.
- An 'Energy Perspectives' section which contains refereed papers that review or analyse important current issues from a broader vantage point, and which contribute to advancing the research frontier in energy economics.
- A ‘Book Review’ section which examines books and topical government reports (national and international) on energy economics, energy policy and related areas.
Special Issues of the Energy Journal are by invitation only. The Editorial Board of The Energy Journal will propose Special Issues that will be assigned to Special Issue editors.
Important Links
Global Reach
The manuscripts we receive indicate the global reach of the Energy Journal. Our submissions come from Europe (37%), Asia/Oceania (33%), North America (21%), and the rest of the world (9%).
Peer Review
All papers undergo a rigorous peer-review process with an acceptance rate of 16%. The average time for an editorial decision is 44 days, ensuring a thorough and efficient review process.
Follow us on WeChat
Chinese-speaking readers can now follow The Energy Journal on WeChat for curated updates, article highlights, and announcements delivered in Mandarin. Scan the QR code to subscribe to our official WeChat channel.
Our WeChat channel provides timely notifications about new issues, special topics, and IAEE events - tailored for our growing readership across China and the broader Chinese-speaking academic community.
关注我们的微信公众号
中文读者现在可以通过微信关注《能源经济学期刊》,获取精选文章摘要、最新研究动态以及 IAEE 活动资讯。请扫描二维码订阅我们的官方微信公众号。
我们的微信公众号将及时推送期刊新刊通知、专题内容及学术活动信息,专为中国及全球中文学术读者群体量身打造。
Access the Energy Journal
IAEE members enjoy unlimited access to the Energy Journal as a complimentary membership benefit. Non-members may purchase articles and full issues or subscribe to the journal via the Sage website.